Opportunity youth in phoenix
Heat Map Breakdown
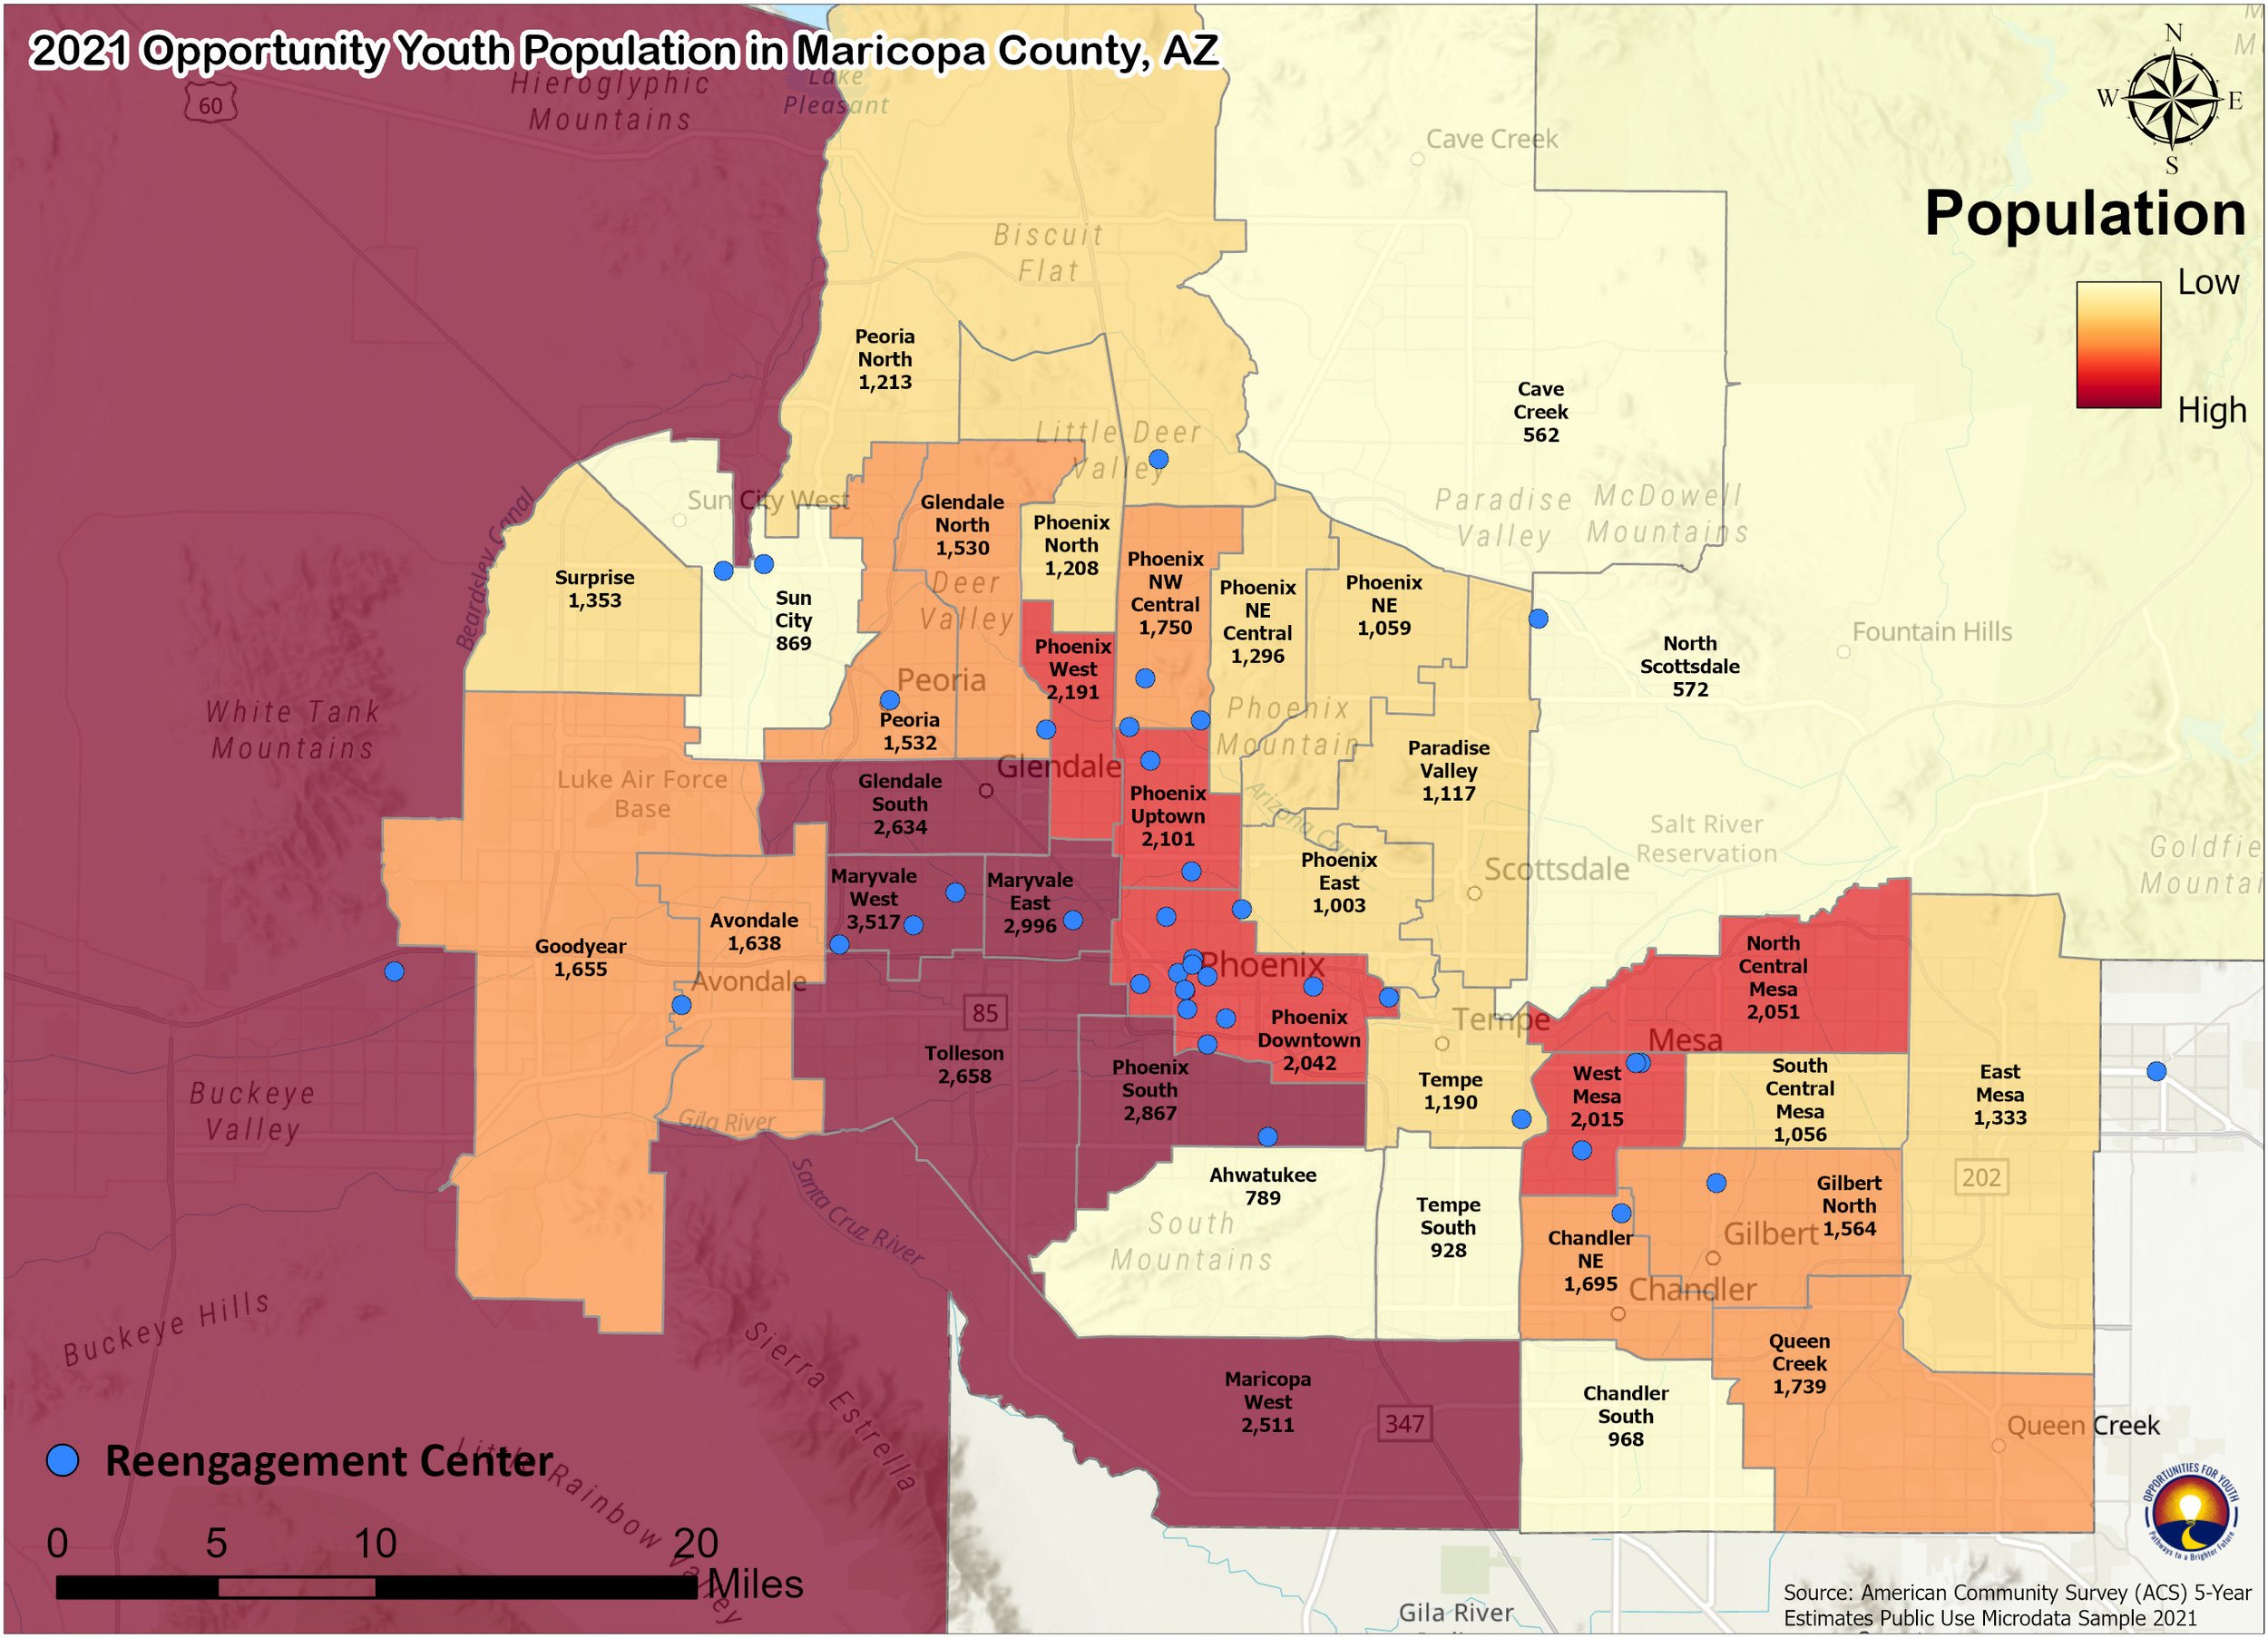
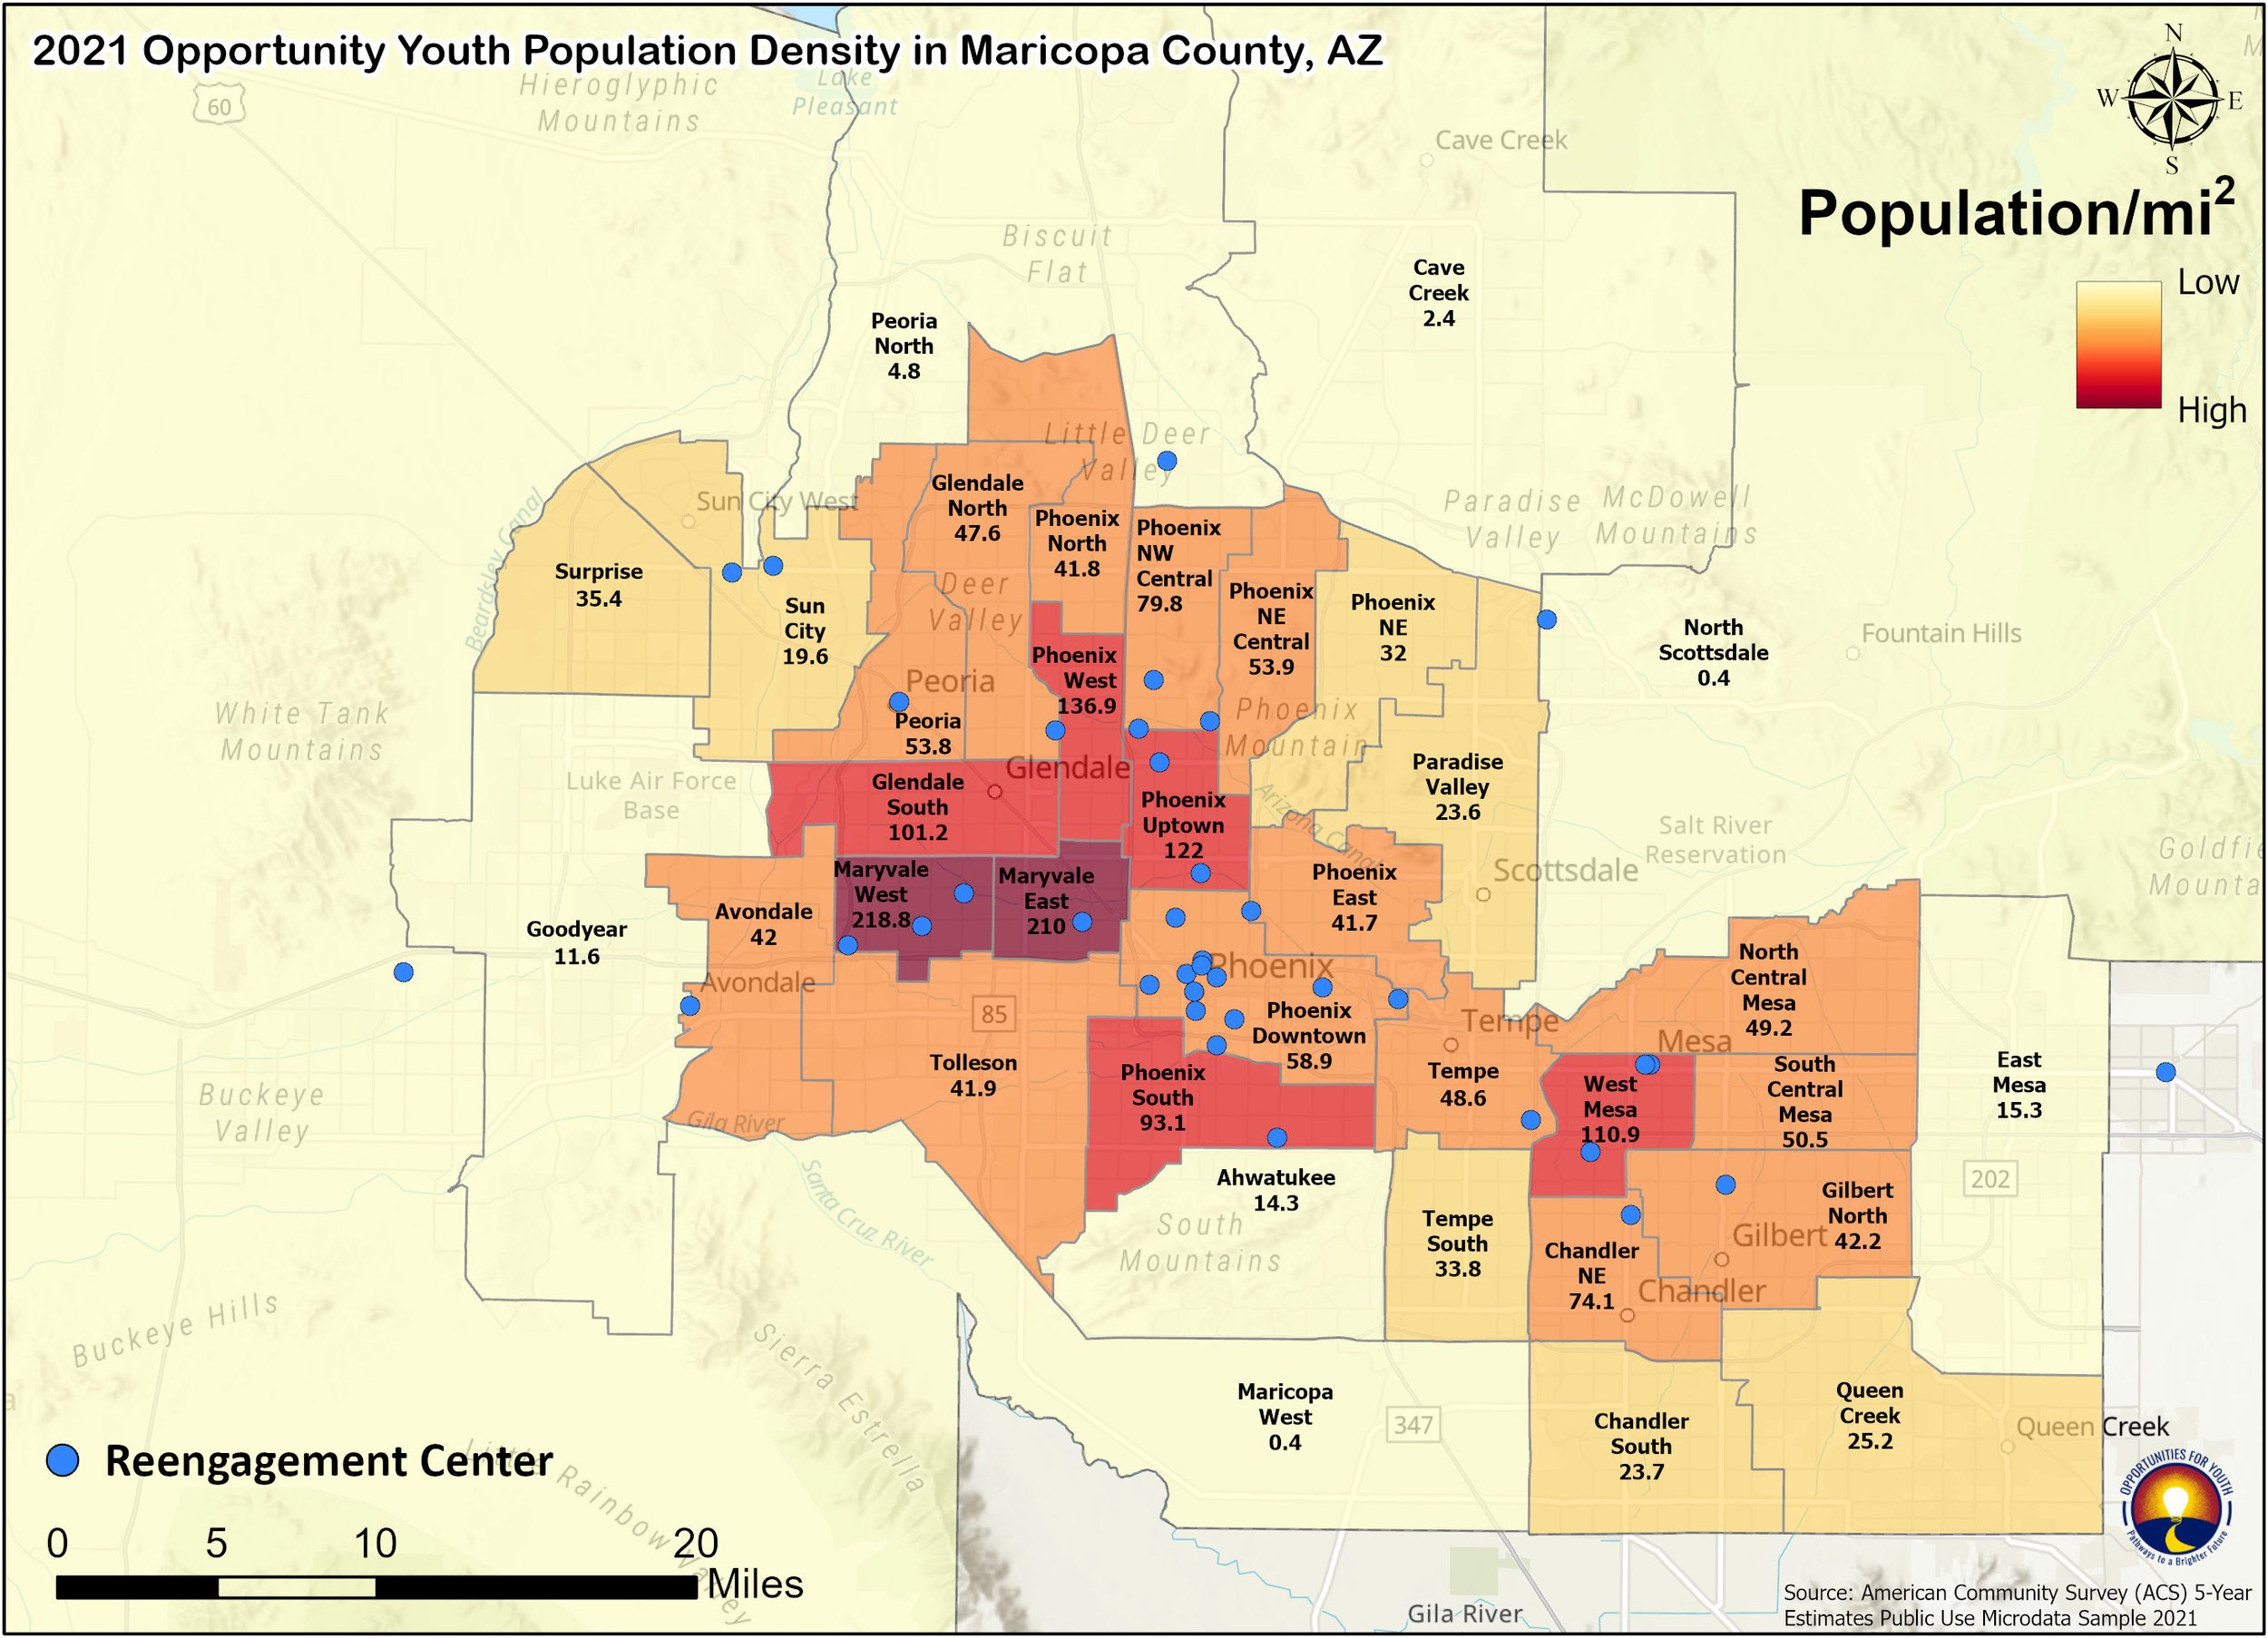
By better understanding where opportunity youth (OY) reside, we are better able to bring support services to them, providing them with resources and opportunities to overcome their barriers to success.
Opportunity Youth in the Phoenix Metro Area
The following distribution maps were created using 2021 American Community Survey (ACS) 5-year Public Use Microdata Sample (PUMS) from the U.S. Census Bureau. They show the number of OY in each PUMA region, with yellow representing a lower value and red indicating a higher value. Population density is a standardized population, which is calculated as the total population within a region divided by the area of the region.
Phoenix’s Disconnection Rates: Trends Over Time

The Opportunity Youth Forum Common Measures are a set of four metrics to assess the overall opportunity youth disconnection rate, and the disconnection rates for high school, post-secondary and workforce annually at the population level using the US Census Bureau’s American Community Survey. The Common Measures provide a unique annual look into our community’s opportunity youth data and help to track progress and inform strategies.
Opportunity Youth in Arizona
Opportunity youth distribution map, created using 2018 American Community Survey (ACS) 5-year Public Use Microdata Sample (PUMS) from the U.S. Census Bureau.
Opportunity Youth Across the United States
Opportunity youth distribution map, created using 2018 American Community Survey (ACS) 5-year Public Use Microdata Sample (PUMS) from the U.S. Census Bureau.